How much greenhouse gas emissions are associated with our products along their lifecycle? And how do we plan to measure and reduce the carbon footprint of our products? Read on to find out.
We have set a highly ambitious goal to achieve net zero emissions by 2050, however, to provide our customers with products with the lowest footprint, we also need to examine our upstream scope 3 emissions. One way to help do this is to assess our product carbon footprints.
WHAT ARE product carbon footprints?
Product carbon footprints (PCF) measure the environmental impact of our products (based on greenhouse gas emissions) from cradle to gate. In other words, the carbon impact of our product from resource extraction or “cradle” up to the factory gate.
It is the most established method to determine the climate impact of a material. It is also possible to valorise a product’s entire life cycle – from raw material extraction to recycling or disposal – if we know the typical end use. However, as a mid-value chain company, we are often not the face to the consumer and so do not always know the final application: therefore, we take the scope of cradle-to-gate.
Cradle-to-grave and cradle-to-cradle are typically used for full life cycle assessments (LCAs). Product carbon footprints can be viewed as a sub-section of an LCA, focusing on quantifying carbon emissions (also referred to as Global Warming Potential – GWP). A full LCA investigates several impact categories that are defined by the method employed. They are often used to compare alternative products (e.g. plastic bottle vs. paper carton), and so knowing disposal (cradle-to-grave) and recycling (cradle-to-cradle) routes becomes essential.

Environmental impact assessment
How are product carbon footprints calculated?
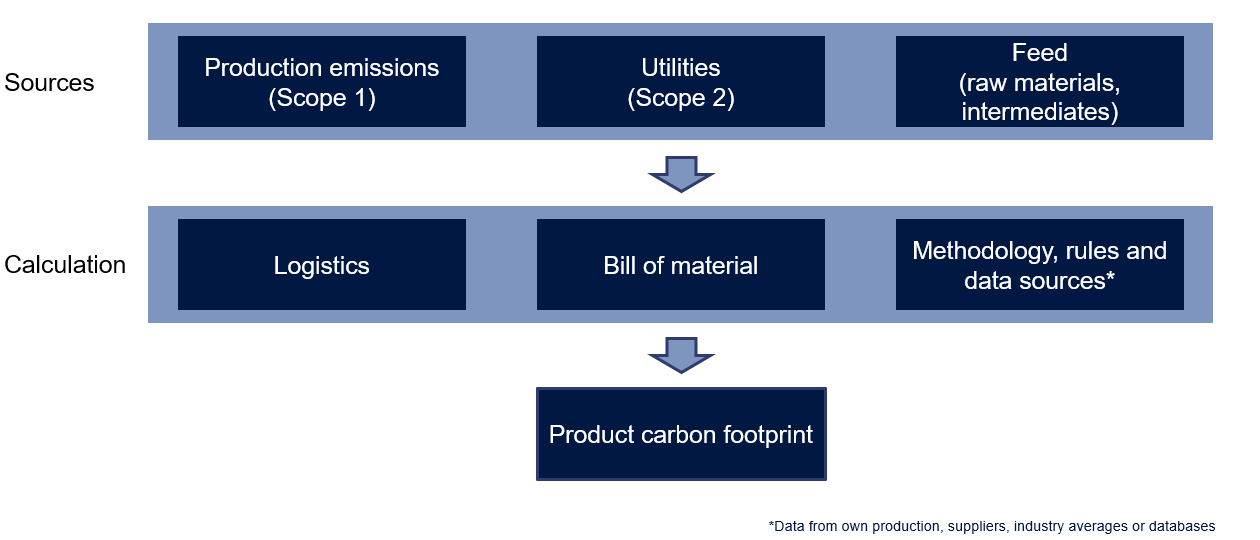
How product carbon footprints are calculated
Ben Routledge, our Global Sustainability Specialist, responsible for measuring our LCAs and PCFs says: “We analysed the inputs (raw materials and utilities such as electricity) and outputs (emissions and waste) of all the processes that took place over the life cycle of the product from cradle to gate. Then, we converted the various emissions into carbon dioxide equivalent (CO2e). This helped us determine the product carbon footprint or emissions per unit of product. Calculating PCFs for our products has helped us to identify hotspots, and with the right measures, will enable us to reduce or (ideally) completely avoid the impact of these hotspots”.
So far, we have verified the PCFs of 28 products from multiple sites globally, but our journey has only just begun. We aim to provide carbon footprint values in order to assist with our customers’ Scope 3 obligations and aid our commitment to the environment and circular economy.
What are our findings?
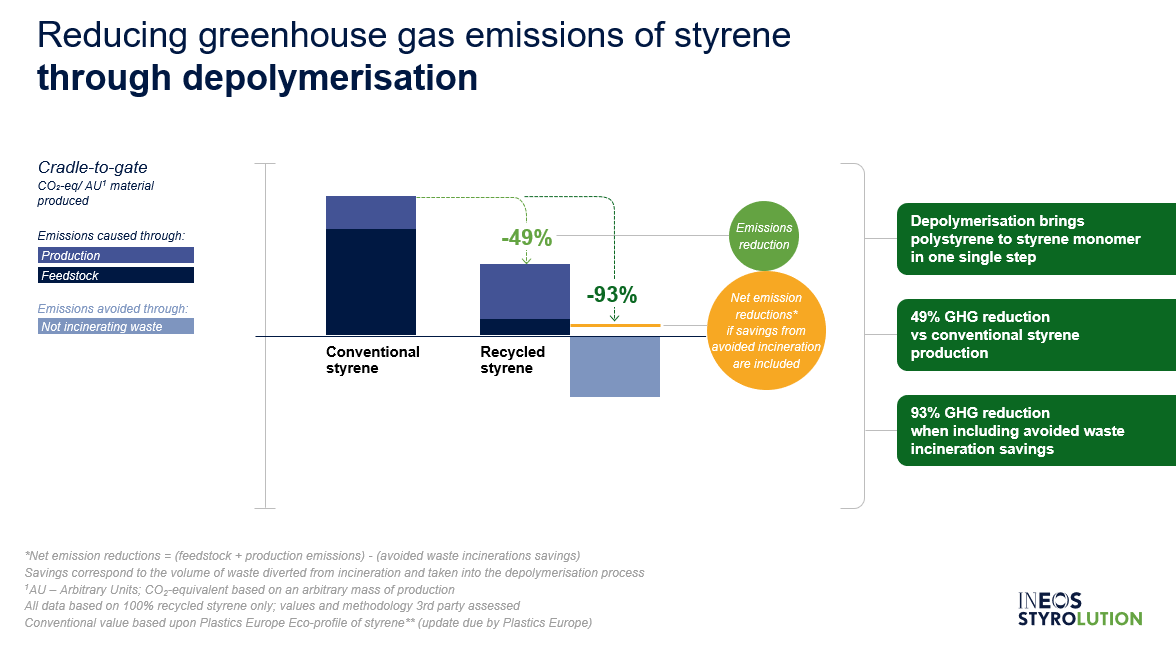
The assessments of our depolymerisation process show a GHG reduction of 24% to 49% versus conventional production depending on the type of polymer produced.
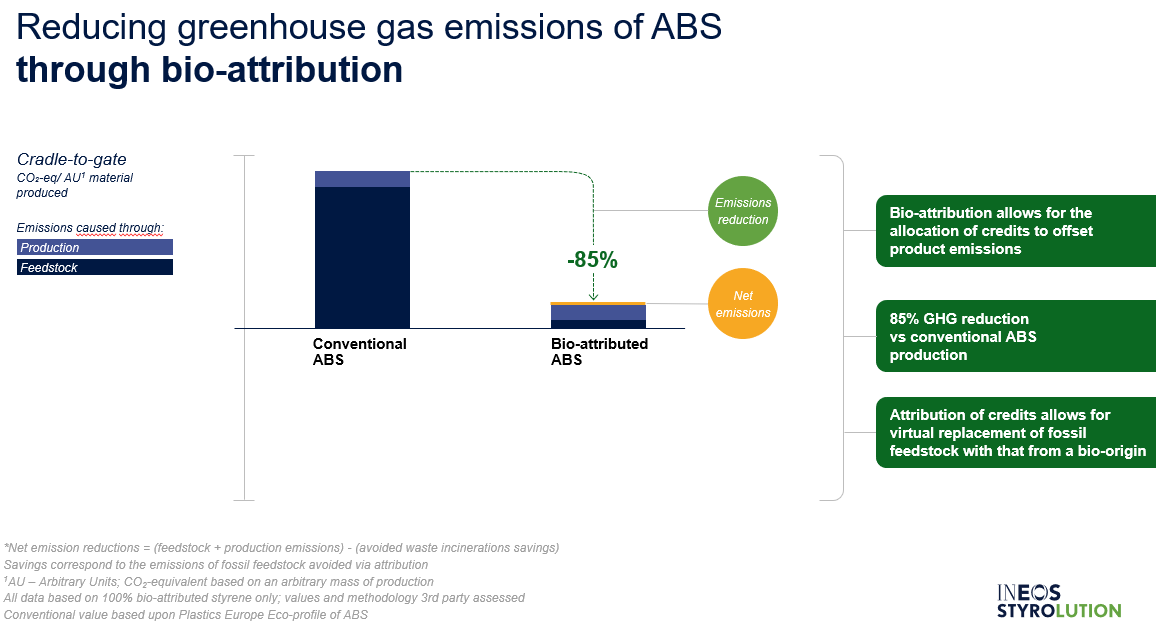
The assessments of our bio-attribution process show a GHG reduction of 85% to over 100% versus conventional production depending on the type of polymer produced. Savings of over 100% is possible because the bio-naphtha originates from plant material. Plants sequester (take in and store) carbon from the atmosphere enabling it to be “locked” within the naphtha.
All our PCFs comply with ISO 14040 and have been independently verified by Ethos Research and by Scientific Certification Systems (SCS Global Services) as part of the Roundtable on Sustainable Biomaterials (RSB) audits of our sites.
Our biggest challenges are data sourcing and methodology as there is no single industry standard. Methodologies and data quality differ between parties resulting in varying carbon footprint values depending on variables such as emissions factors and calculation assumptions.
Ben adds: “We are now looking into software that will automate the process of generating PCFs for our products. We too expect digital product passports to become common place, if not mandatory, in the not-too-distant future. These will not only include carbon emissions data but likely also technical, regulatory and other sustainability profiles of the product. We hope this will help promote sustainable production and accelerate the transition to a circular economy.”
SUPPORTING OUR CUSTOMERS' SUSTAINABILITY ASPIRATIONS
Our ECO solutions enable our customers to develop competitive sustainable solutions and PCFs allow us to quantify our sustainability claims. Our PCF data can be used by our customers to calculate the PCF of their applications and help them achieve their ambitious sustainability targets.
**************************************************************************************************
What are scope 1, 2, and 3 emissions?
…The Greenhouse Gas Protocol classifies a company’s GHG emissions into three scopes.
Scope 1 emissions are direct emissions from fossil fuel consumption at our sites, CO2 equivalents from N2O (nitrous oxide) and CH4 (methane), and process emissions from refrigerants such as HFC (hydrofluorocarbons), PFC (perfluorocarbons), CFC (chlorofluorocarbons) and HCFC (hydrochlorofluorocarbons).
Scope 2 emissions are indirect emissions from the generation of purchased energy and utilities such as electricity and steam.
Scope 3 emissions are all indirect emissions (not included in scope 2) that occur in the value chain of the reporting company, including both upstream and potentially downstream* emissions as well.
*cradle-to-gate mostly focuses on upstream, cradle-to-grave includes downstream
Did you know…
A bill of material is a comprehensive list of all the items (raw materials, assemblies, subassemblies, parts and components ) that are required to build a product.
How is a product carbon footprint measured?
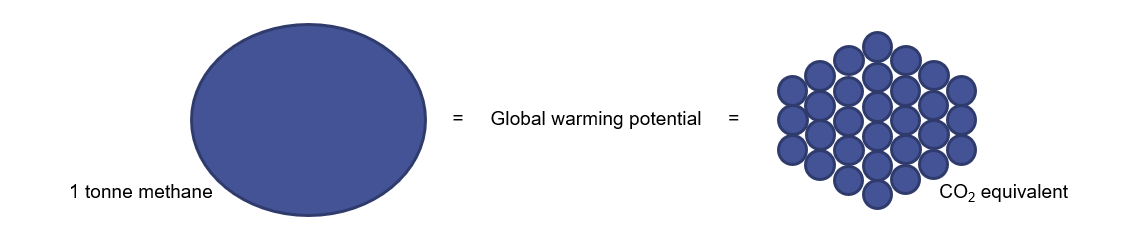
Carbon footprints are quantified in carbon dioxide equivalents (CO2e). The carbon dioxide equivalent CO2e is calculated using the mass of a given greenhouse gas (GHG) multiplied by its global warming potential (GWP). For instance, methane’s GWP is 28-36, meaning 1 tonne of methane will have the same warming effect as 28-36 tonnes of CO2 over a period of 100 years* (Environmental Protection Agency value). The product carbon footprint (PCF) sums all sources of emissions as a CO2 equivalent value.